4,602 regions,
one SVG file.

Click any country, state or province and a chart opens inside the map, drawn from JSON you control. No libraries. It works in a blank HTML page.

Last click none yet: try Selangor or your own state

Drag to pan. + − or Ctrl/⌘ and scroll to zoom. Keyboard: Tab in, arrows move, Enter opens.Tap a region for its chart. Pinch to zoom, drag to pan once zoomed in.

34.4M

Malaysians, counted state by state

Real figures, not filler: OpenDOSM’s 2026 estimates for all 16 states and federal territories, the same series each state’s chart shows. Every other country carries World Bank population, GDP per capita and life expectancy. Pick a bar to open that state on the map.

Zoom in. It stays sharp.

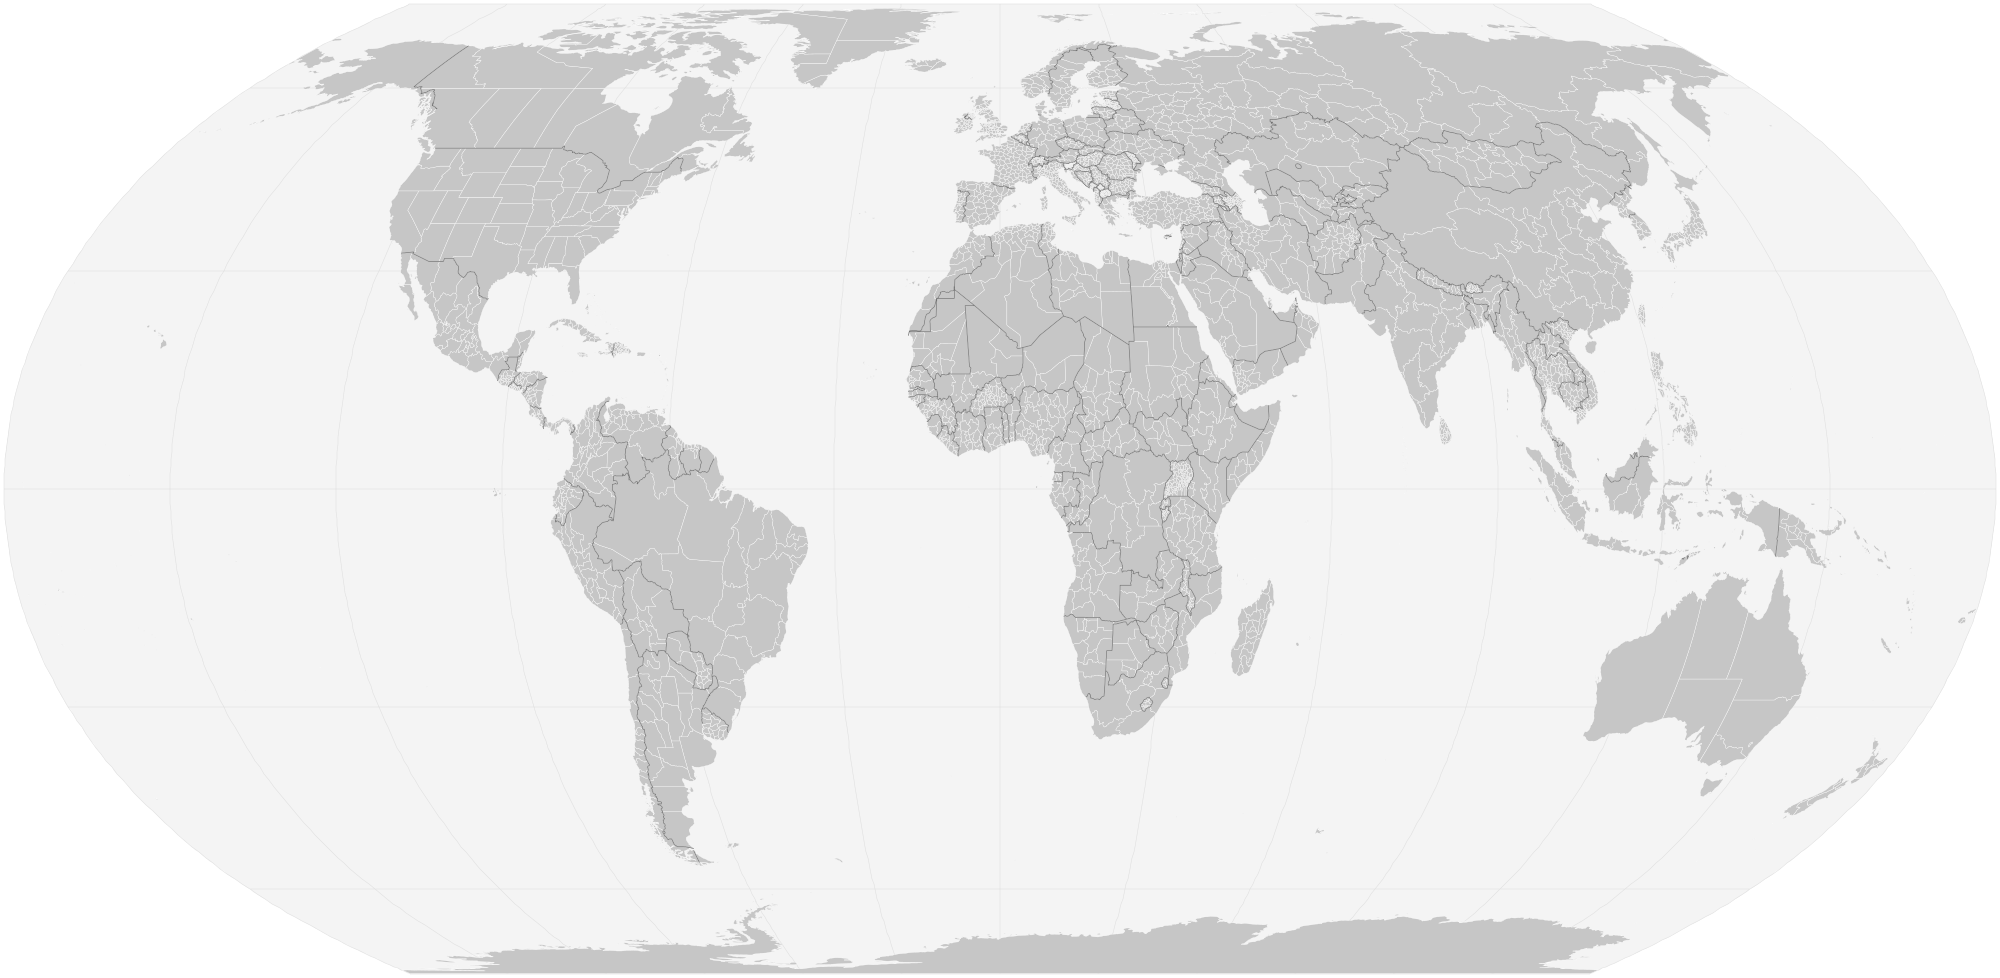
  1. The whole world, at 1×

    257 countries and territories and 4,602 first-level regions in one file of 1.3 MB, 417 KB when the server compresses it. Each shape has its own ID: ISO 3166-1 for countries, ISO 3166-2 for regions, or Natural Earth’s own code for the 349 without a unique one.

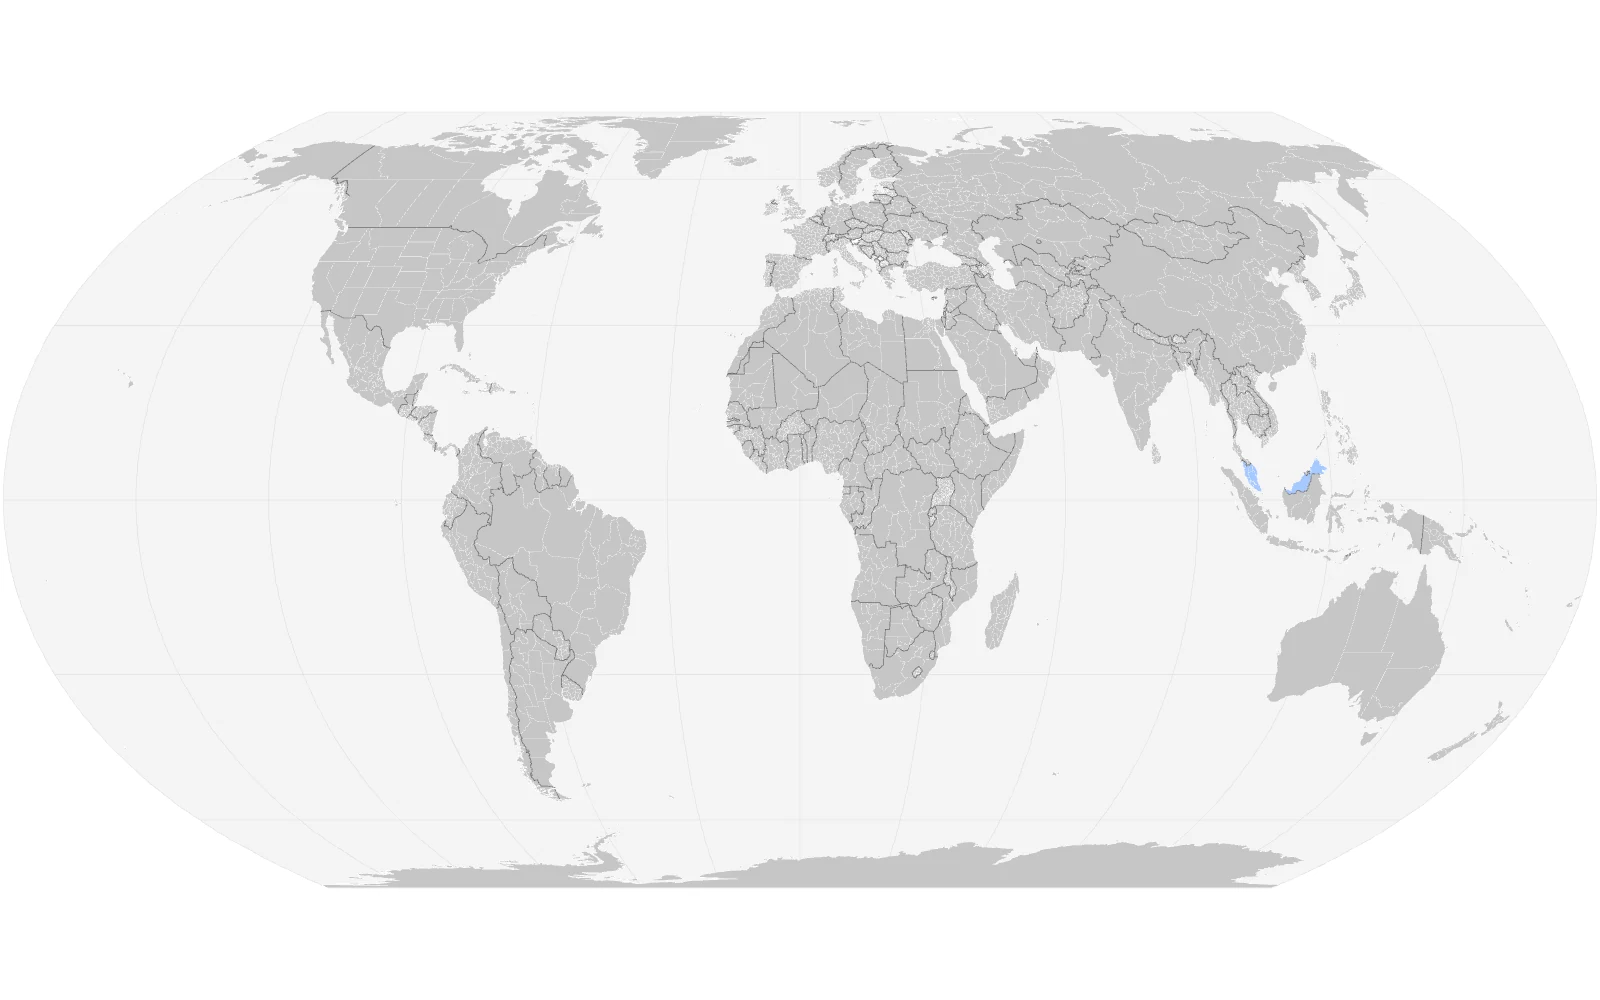
    The full world map at its starting size, every country split into its states and provinces, Malaysia tinted blue.
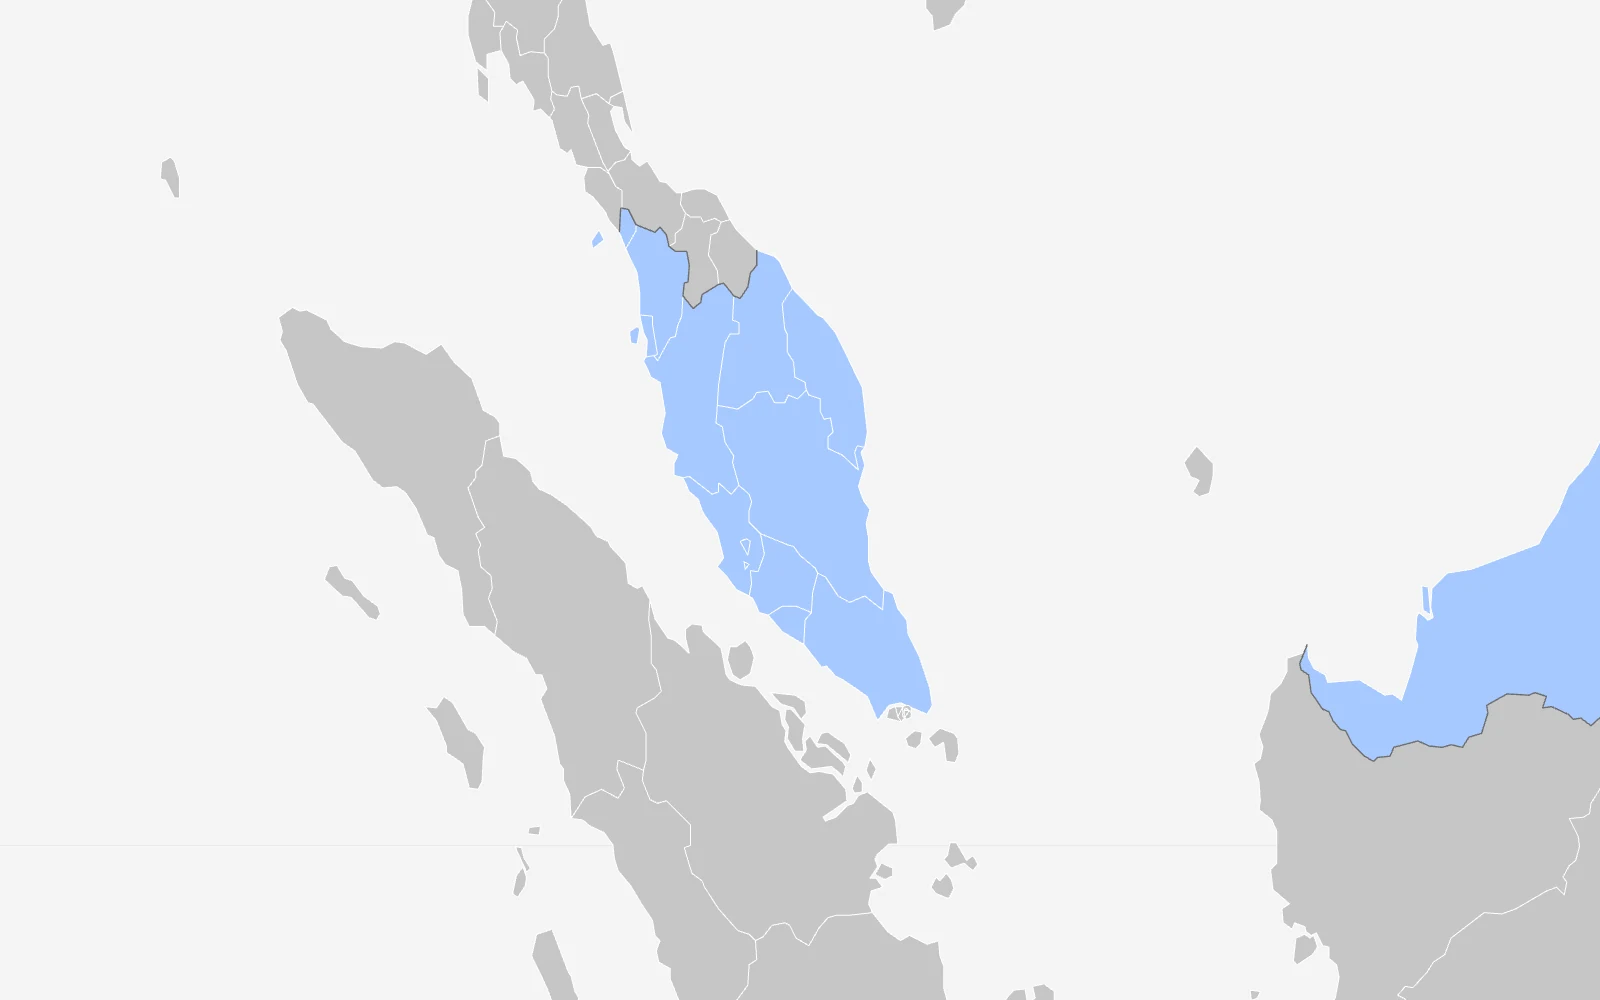
  2. Southeast Asia, at 8×

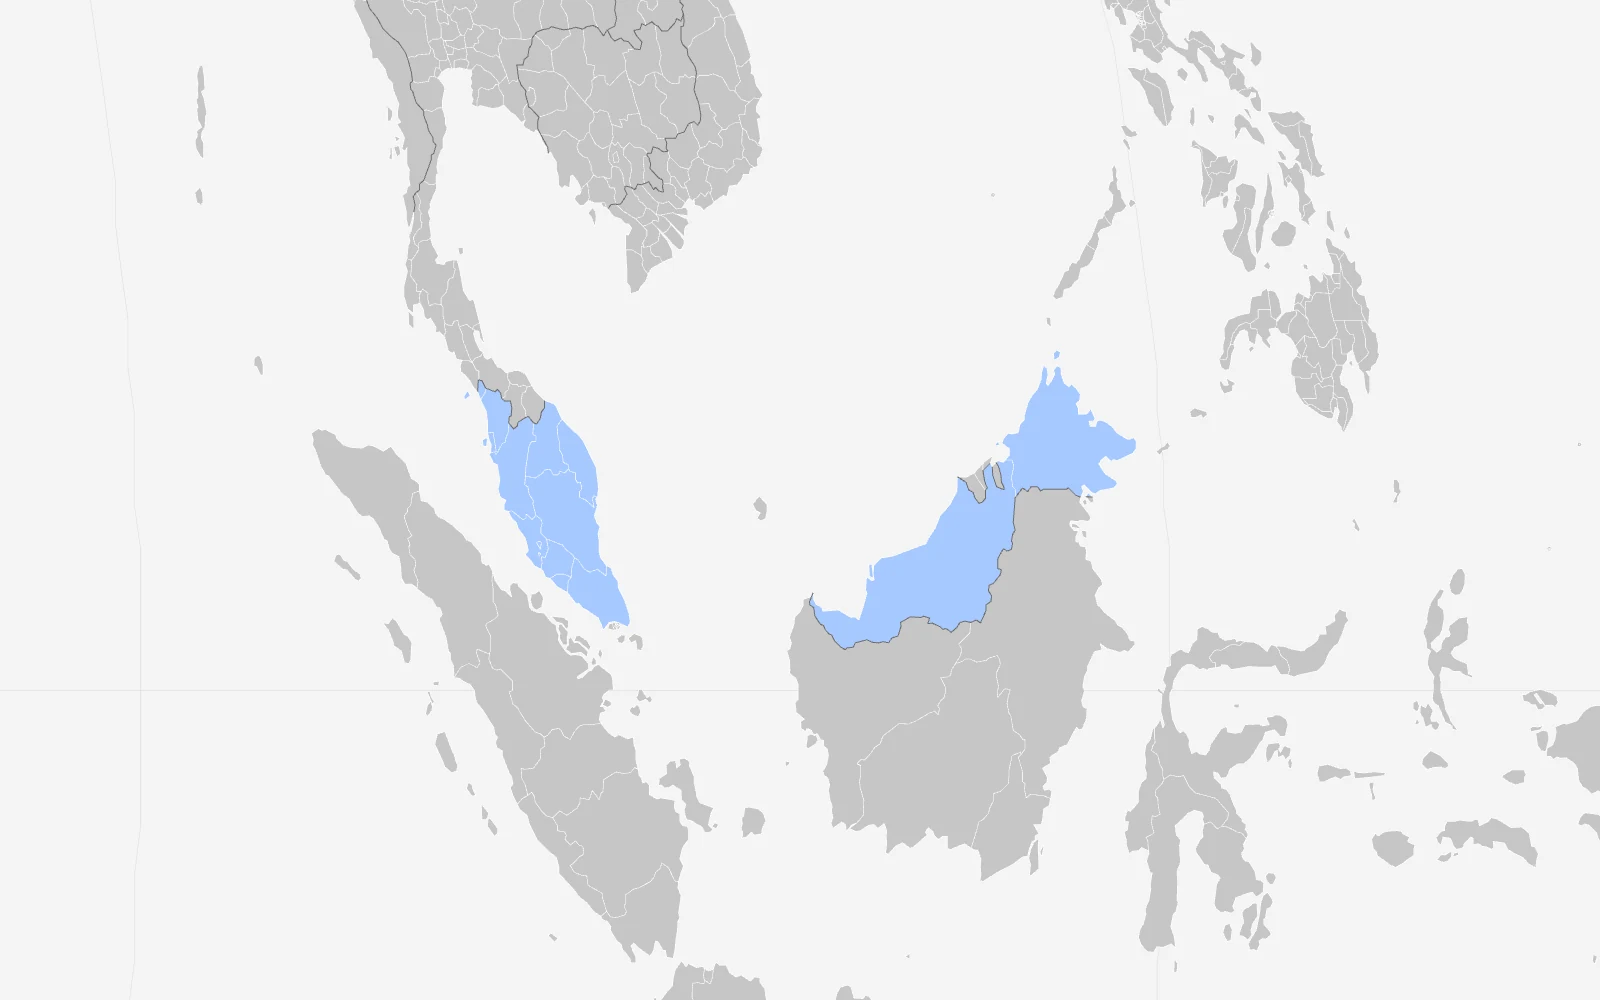
    Malaysia’s states are tinted because they carry their own figures. Grey regions fall back to their country’s numbers, and say so.

    The map zoomed eight times on Southeast Asia: Peninsular Malaysia, Sabah and Sarawak tinted blue among grey neighbours.
  3. Peninsular Malaysia, at 16×

    Borders stay one screen pixel wide however far you go in, so outlines read as lines, never as smudges.

    The map zoomed sixteen times on Peninsular Malaysia, each state outlined in thin white lines.
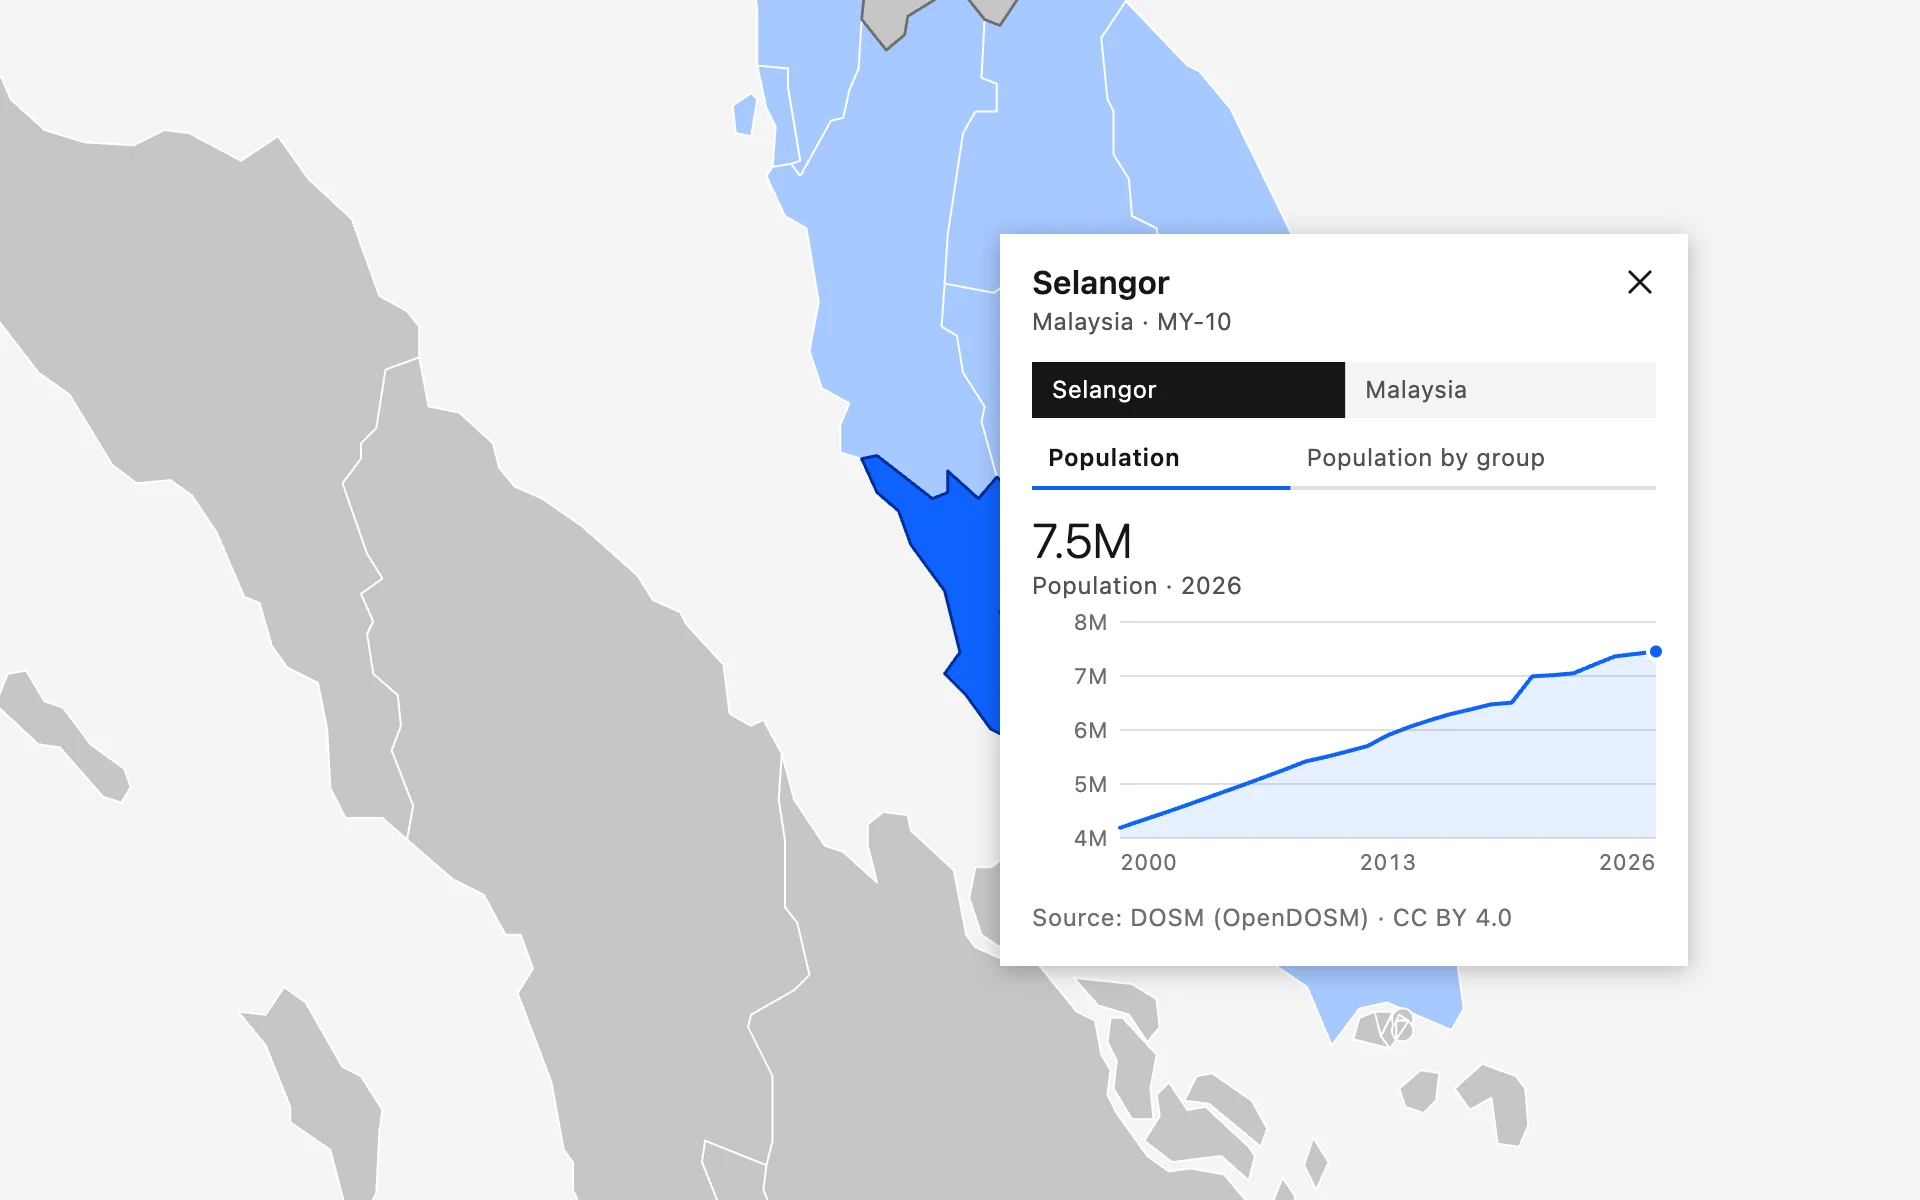
  4. Selangor, at 32×, chart open

    The chart panel is drawn in screen pixels, so it keeps the same readable size at every zoom level and on every screen.

    The map zoomed thirty-two times on Selangor, selected in blue, with its population chart panel open beside it.

Embed it in four moves

First, put the file on a page.

<object data="peta-dunia.svg"
        type="image/svg+xml"
        style="width:100%;aspect-ratio:2/1">
  World map
</object>
<!-- any JSON in the format below -->
<object data="peta-dunia.svg?data=/sales.json"
        type="image/svg+xml"></object>

{ "regions": { "MY-10": { "charts": [
  { "type": "line", "title": "Orders",
    "unit": "orders", "start": 2020,
    "values": [120, 180, 260, 410] }
] } } }
// from the page around the map
window.addEventListener("message", (e) => {
  if (e.data.type === "petadunia:select") {
    console.log(e.data.detail.id);   // "MY-10"
    console.log(e.data.detail.name); // "Selangor"
  }
});
const map = document.querySelector("object")
  .contentWindow.PetaDunia;

map.select("MY-10");          // open a chart
map.zoomTo("MYS");            // frame a country
map.load("/q3.json");         // swap the data
map.close();

The files you get

peta-dunia.svg

1.3 MB · 417 KB gzipped · the deliverable

Download

Every shape, the styles, the script and the real data in one minified file. Countries are groups, regions are paths:

<svg id="peta-dunia" class="pd" viewBox="0 0 2000 978"
     role="group" aria-roledescription="interactive map">
  <g id="MYS" role="group" aria-label="Malaysia">
    <path id="MY-01" aria-label="Johor" d="M1567.5 470.7l-.5.6…"/>
    <path id="MY-10" aria-label="Selangor" d="M1557.4 460.1l.5 1.1…"/>
    …
  </g>
  <script type="application/json" id="pd-data">…</script>
  <script>/* 23 KB, no dependencies */</script>
</svg>

world.json

173 KB · real data, 233 regions

Download

World Bank series for 217 economies and OpenDOSM figures for Malaysia’s 16 states, written by tools/fetch-data.mjs:

{ "sources": {
    "dosm": { "name": "Department of Statistics Malaysia",
              "licence": "CC BY 4.0" } },
  "regions": {
    "MY-10": { "charts": [
      { "type": "line", "title": "Population",
        "unit": "people", "source": "dosm",
        "start": 2000,
        "values": [4188900, 4317500, … 7454200] },
      { "type": "bar", "title": "Population by group, 2026",
        "labels": ["Malay", "Chinese", "Indian", …],
        "values": [4080200, 1757100, 731500, …] } ] } } }

sample.json

2 KB · mock data, four regions

Download

The brief’s sample: invented numbers for Selangor, France, São Paulo and California, marked as mock everywhere they show.

{ "mock": true,
  "regions": {
    "US-CA": { "charts": [
      { "type": "bar",
        "title": "Support tickets by topic",
        "unit": "tickets",
        "labels": ["Billing", "Shipping", "Returns",
                   "Account", "Other"],
        "values": [320, 510, 240, 130, 90] } ] },
    "FRA":   { … },  "BR-SP": { … },  "MY-10": { … } } }

regions.csv

177 KB · 4,602 rows

Download

Every ID on the map with its name and country, so you can key your own data without opening the SVG.

idnamecountry_idhas_data
MY-01JohorMYSregion
MY-14Kuala LumpurMYSregion
MY-10SelangorMYSregion
DE-BYBayernDEUcountry
FR-75ParisFRAcountry
ATA-00AntarcticaATAnone

blank.html

1 KB · the acceptance test

Open it

The brief’s test, word for word: a blank page, the SVG, nothing else. Click any region and the chart appears, with a clean console.

<!doctype html>
<html lang="en">
<meta charset="utf-8">
<title>Peta Dunia: acceptance test</title>
<body style="margin:0">
<object data="peta-dunia.svg" type="image/svg+xml"
        style="display:block;width:100%;height:100vh">
  World map
</object>
Open shapes,
open numbers.

Read the build scripts
  • 1:10mStates and provinces (admin-1), the detailed 1:10m set4,596 regions, plus 7 small units from the country layer so no land is missingnaturalearthdata.com
  • 8%Simplified with mapshaper, every shape keptVisvalingam weighted; 56 self-intersections repaired; 596 specks get a small markermapshaper
  • 8857Equal Earth projection (EPSG:8857)Areas stay true, so big countries do not look bigger than they areEqual Earth
  • 2000–2025Population, totalSP.POP.TOTL, line chart, 217 economiesWorld Bank WDI
  • 2000–2025GDP per capita, current US$NY.GDP.PCAP.CD, bar chartWorld Bank WDI
  • 2000–2024Life expectancy at birthSP.DYN.LE00.IN, line chart, in yearsWorld Bank WDI
  • 2000–2026Population by stateDataset population_state, line chart for each of the 16 states and federal territoriesOpenDOSM
  • 2026Population by ethnic groupMalay, other Bumiputera, Chinese, Indian, other citizens, non-citizens; bar chartOpenDOSM
  • ’000Published in thousands, stored as peopleThe fetch script multiplies by 1,000 so tooltips read in plain numbersdata.gov.my
  • 4Invented figures for four regionsSelangor, France, São Paulo and California: line, bar and category chartssample.json
  • 0Every other region shows the no-data chartA clear empty state that names the ID to add, never an errorTry it on the map

Fair questions

  • Yes. blank.html is a blank page holding only the SVG. Click any region and its chart appears straight away, with no console errors, in Chrome, Firefox and Safari, opened from a server or straight from disk.

  • A region without its own figures shows its country’s, labelled as such. Where neither exists, the panel draws an empty chart that says so and names the ID to add. It never throws.

  • The map is one Tab stop. Arrow keys move to the nearest region in that direction, Page Up and Down jump between countries, and typing a name finds it. Enter opens the chart, Escape closes it.

  • Point the map at any JSON with a regions object keyed by the IDs in regions.csv. Each region holds a list of line or bar charts: a start year and values, or labels and values.

  • The brief asked for minimal dependencies. Two chart types and pan and zoom fit in 23 KB of plain JavaScript inside the SVG, so there is nothing else to load, update or break.

  • Natural Earth’s, which follow the boundaries in place on the ground. Disputed areas keep Natural Earth’s own codes. Swap the source data and rebuild if a client needs another view.

Yes. blank.html is a blank page holding only the SVG. Click any region and its chart appears straight away, with no console errors, in Chrome, Firefox and Safari, opened from a server or straight from disk.

Want it with your own numbers?

Swap in your JSON and the same map charts it. The code is MIT, the build scripts are in the repo, and blank.html proves it in one click.